

Danial
UK Traffic Accidents Analysis
A major injury is defined as one that requires hospitalization as an inpatient or any of the following injuries, whether or whether they require hospitalization: fractures, concussions, internal injuries, being crushed, burns (except friction burns), severe cuts, severe general shock requiring medical treatment, and injuries that result in death 30 days or more after the accident. On the basis of information available within a short time following the accident, police classify casualties as gravely injured or slightly injured. This will not usually reflect the findings of a medical examination, although it may be influenced by whether or not the victim is hospitalised.
A minor injury is defined as a sprain (including whiplash), a bruise or cut that isn't considered severe, or a small shock that necessitates roadside assistance. Injuries that do not require medical treatment are included in this definition.
There are three main sources of safety information in the United Kingdom:
The majority of the information in this report comes from STATS19, which is also available in the IRTAD database. While the police report all fatal crashes, statistics from hospitals, surveys, and compensation claims show that the police are unaware of a significant number of non-fatal casualties. According to the most recent estimate – based mostly on data from the 2017 National Travel Survey – the overall number of road fatalities in the United Kingdom each year, including those not reported to the police, is between 590 000 and 760 000, with a median estimate of 670 000.
By combining hospital HES data with police data from England, researchers can gain a better picture of injury severity and outcomes. Around 40% of the badly injured victims recorded by the police in England match hospital records. The Department of Transport has been using the Maximum Abbreviated Injury Scale (MAIS) to rate the severity of injury crashes as part of this relationship.
Some police departments switched to a new reporting system for major injuries in 2015/16, and it's likely that the documentation of serious injuries is more accurate for officers who use the new systems. This had a significant impact on the number of major injuries recorded in 2016 and 2017, making it impossible to compare the two years directly.
In 2019, the number of people killed on the roads in the United Kingdom fell. In 2019, 1808 people died in traffic accidents in the United Kingdom, according to the most recent data available. This is a 1.7 percent decrease from the previous year. In 2018, there were 1839 reported traffic deaths, down 0.9 percent from 2017.
In the United Kingdom, the longer-term trend in road mortality has been promising. The number of yearly traffic deaths decreased by 49% between 2000 and 2019. The most significant reductions occurred between 2000 and 2010, when annual fatality totals plummeted by 47%. Since then, the decline in road fatalities has slowed: only 7.8% fewer fatalities were recorded in 2019 than in 2011.
Between 2000 and 2019, the number of traffic fatalities per 100,000 people in the UK decreased by 56%. In 2019, there were 2.7 traffic fatalities per 100,000 people, down from 6.1 in 2000. In 2019, the European Union's average death rate was 5.1 per 100 000 people.
In 2019, there were 0.5 fatalities on the roads for every 10,000 registered vehicles in the United Kingdom. When compared to the year 2000, when the rate of deaths from registered automobiles was 1.2, this reflects a 63% drop.
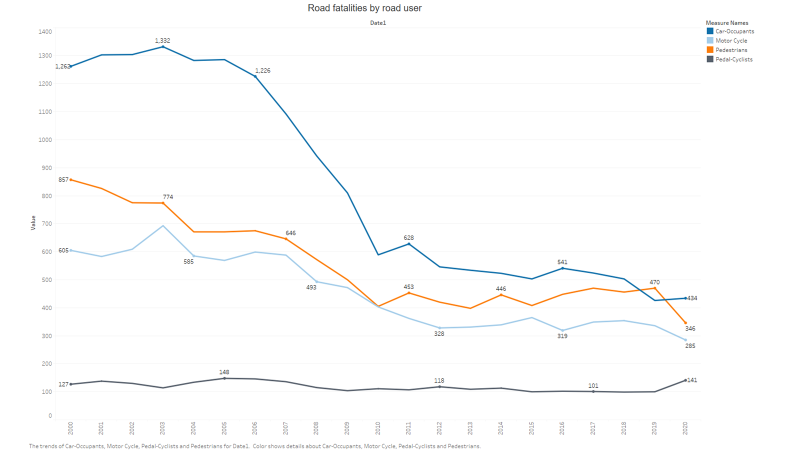
Passenger car occupants continue to be the group most harmed by road crashes, according to data collected by road user groups. Passengers in passenger cars accounted for 44% of all traffic deaths in 2019, according to the latest figures. Pedestrians (28%), motorcyclists (20%), and cyclists (6%), in that order, came in second, third, and fourth.
Pedestrians experienced the greatest rise in fatalities, with 487 deaths in 2019 versus 472 in 2018. Passenger car occupants saw a 4.6 percent reduction in road fatalities, while motorcycle riders had a 4.0 percent reduction.
Since 2000, the long-term trend demonstrates that traffic in the United Kingdom has gotten safer for all road users. Passengers in passenger cars experienced the greatest reduction in fatalities, with 57 percent fewer deaths over the course of the study. Pedestrians (-45%), moped riders (-53%), and motorcyclists (-43%) all had significant increases in road safety during this time period.
Cyclists, who have seen a 22 percent reduction in crash mortality since 2000, are the user group that has benefited the least.
In recent years, the number of road fatalities has dropped for all road users except pedestrians, with the exception of pedestrians, since 2010. While the overall number of fatalities decreased by 5%, the number of pedestrian fatalities climbed by 17%.
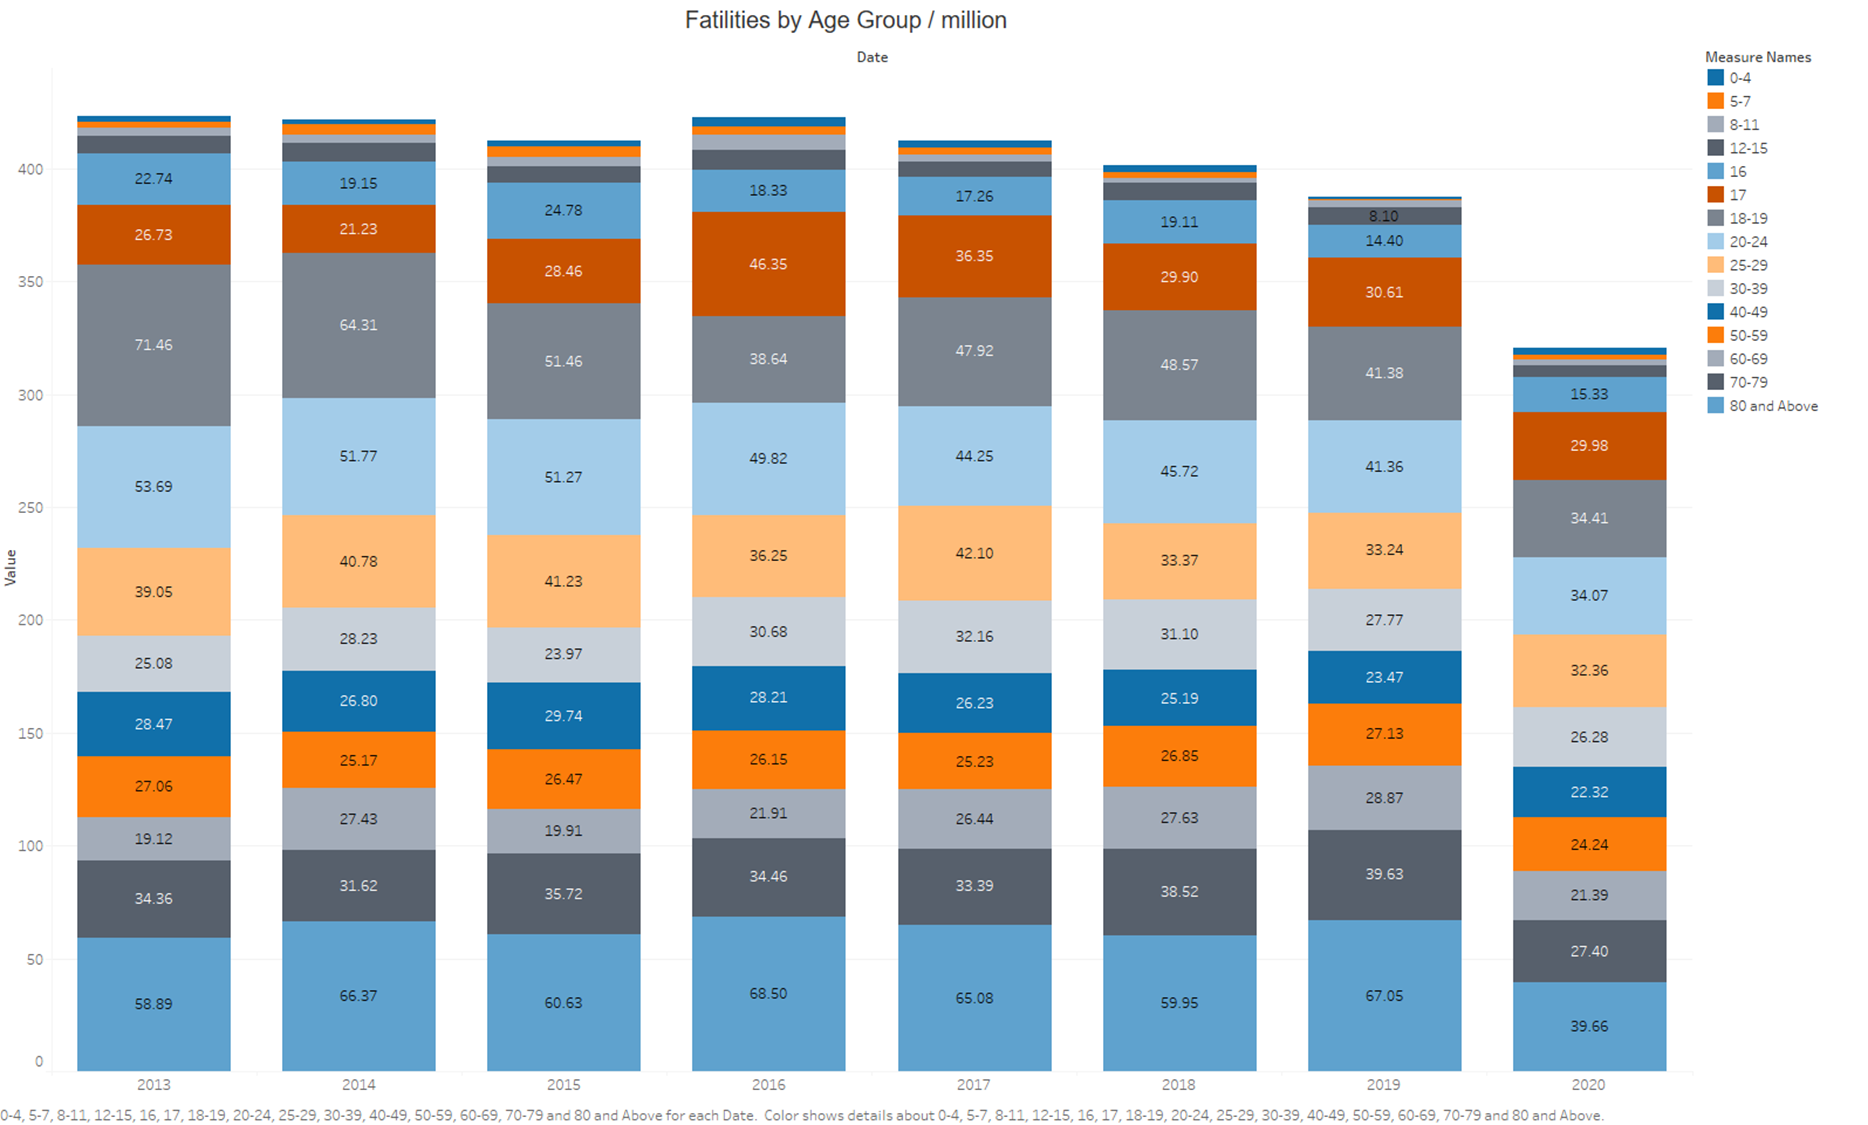
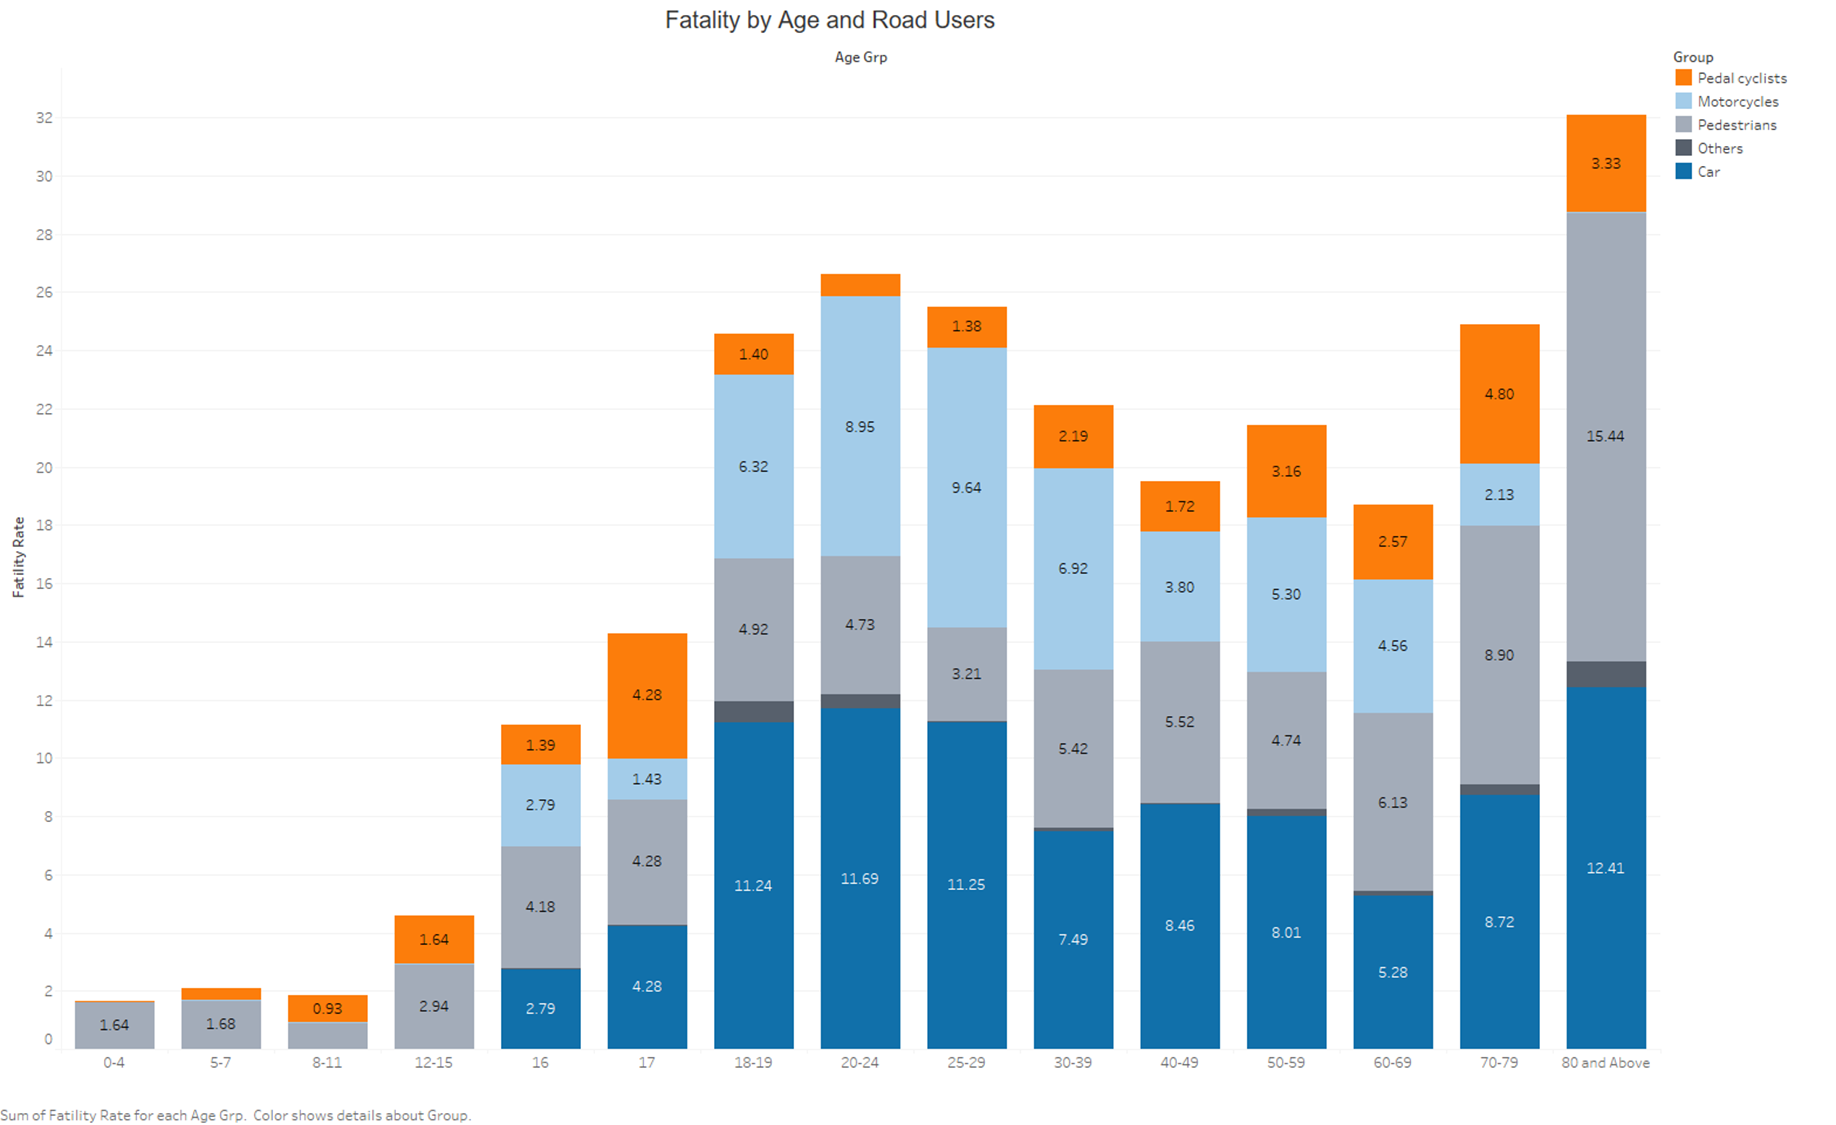
Deaths on the road, by age group:
In comparison to 2018, 2019 showed some changes. Young individuals, in particular, experienced a decrease in fatalities, whilst the geriatric population experienced an increase. In comparison to 2018, deaths among road users aged 0-14 were down 19.5 percent and 9.1 percent among those aged 15-17 were down 9.1 percent. However, between the ages of 65 and 74, there were 2.5 percent more traffic fatalities in 2019 than in 2018.
When looking at the long-term trend, the number of road deaths has fallen for all groups since 2000. The greatest reduction in mortality occurred among young individuals throughout this time period, with fatality reductions of about 70% or more in each age category up to 20 years old. In this time, the number of fatalities in the 21-64 age range was cut in half. Traffic safety improvements benefited the elderly the least, with road fatalities falling by around 26% since 2000.
Since 2010, the number of fatalities has reduced for young people aged 15-17 and 18-20 (see Figure 6), but the situation has deteriorated for the elderly (a 54% increase in fatalities for those aged 65-74 and a 13% increase for those aged 75 and more).
Despite recent improvements, young people remain at significant danger in traffic, with a fatality rate far higher than the national average. The 18-20 age group has a rate of 4.2 per 100,000 people killed in traffic, while the 21-24 age group has a rate of 4.1 per 100,000 people killed in traffic. However, the mortality rate for senior persons over 75 is currently higher than that of young people, with 6.2 road deaths per 100,000 people.
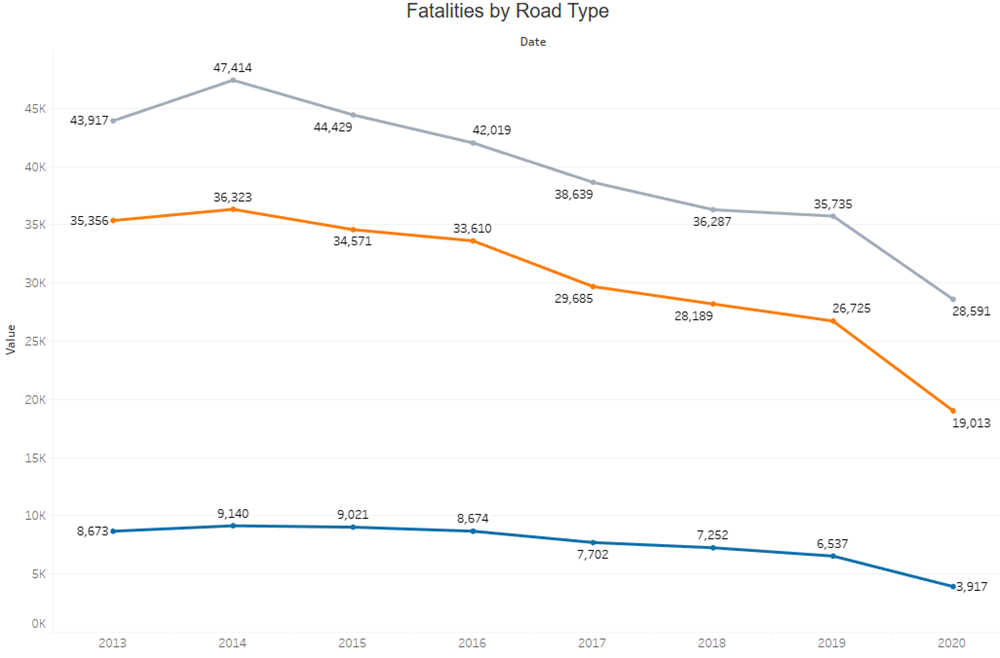
The rural network has a larger proportion of fatalities than other road networks in the United Kingdom, according to an analysis of fatalities by road type. In 2019, rural roads accounted for 58 percent of deaths, while urban roads accounted for 37 percent and highways accounted for 5%. In recent years, this distribution has remained quite steady.
In compared to 2018, the number of road deaths declined 2.4 percent on rural roads and 10.1 percent on highways in 2019, while road deaths increased 1.1 percent on urban roads.
Since 2000, deaths have declined considerably and uniformly across all areas, with each road type experiencing a 40 percent to 50 percent reduction in fatalities in 2019.
Data on fatalities is vital for understanding road safety issues, but it is far from sufficient. It's also crucial to have information on serious injuries caused by crashes. Injury data, on the other hand, is far more difficult to gather, validate, and compare, even when they are available. In the United Kingdom, there were 26 719 major injuries in 2019, up 1.8 percent over the previous year.
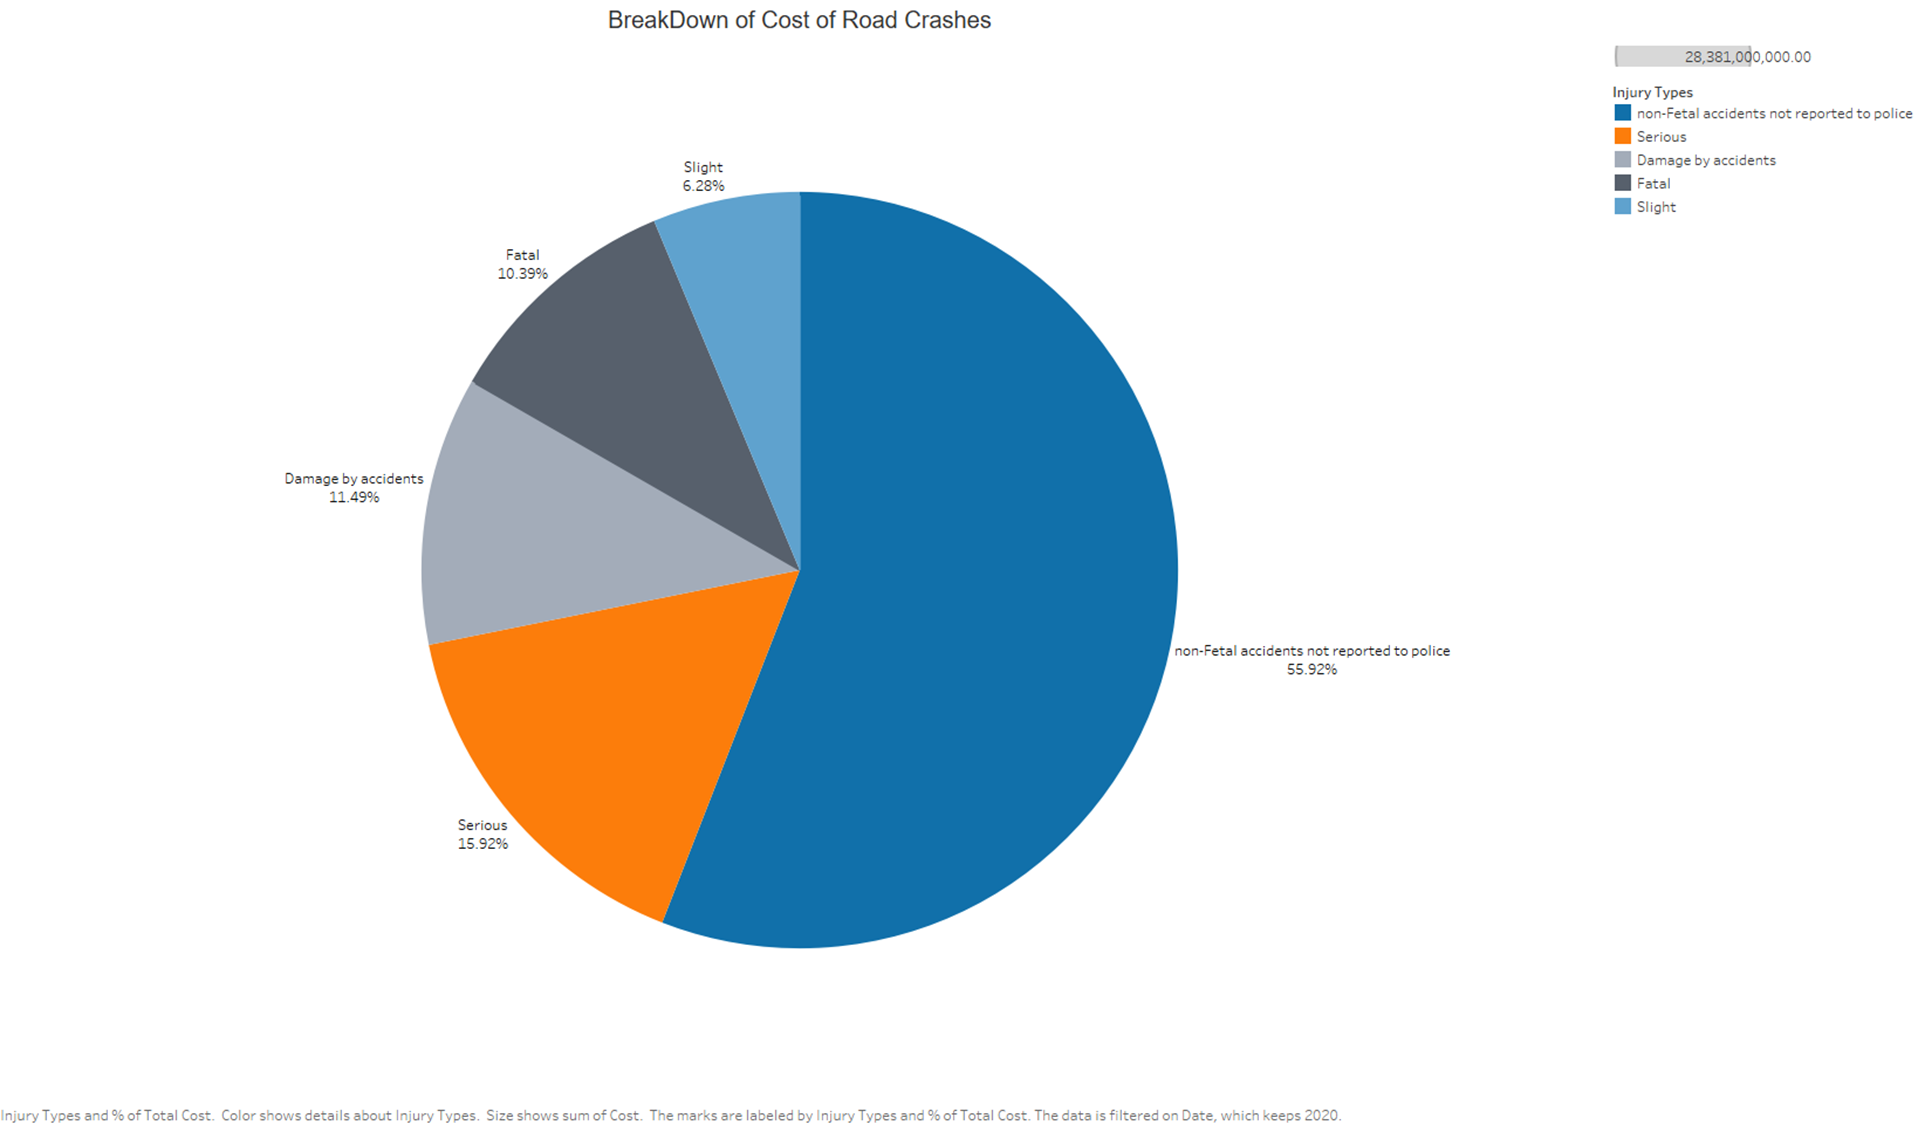
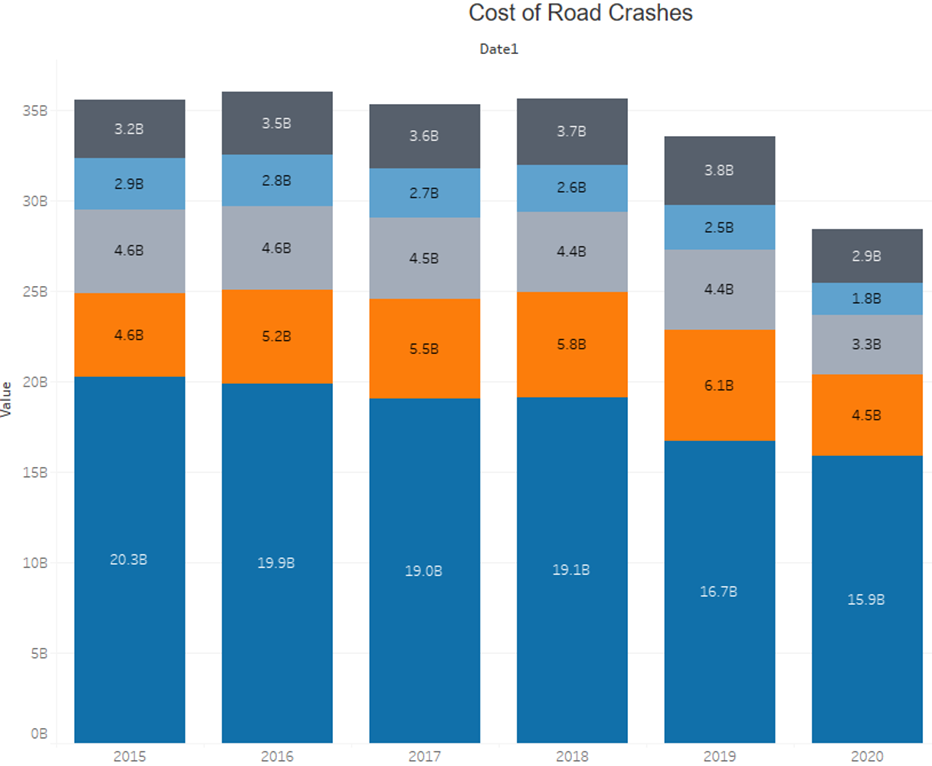
The financial costs of traffic collisions:
Unreported accidents are anticipated to be worth roughly GBP 17 billion per year in 2019, which is more than the value of reported injury accidents. This brings the total cost of all recorded and unreported accidents to approximately GBP 33 billion per year, or 1.5 percent of GDP.
Costs of Road Crashes.
Behavior of Road Users:
Road user behavior is a key factor of a country's road safety performance. One of the biggest contributory factors to road accidents is exceeding the speed limit. Excessive speed was a contributing factor in 14 percent of all reported road fatalities in the United Kingdom in 2019. In 2019, speeding was reported as a contributing cause in 6% of all crashes in the United Kingdom.
The table below summarizes the main speed limits in the United Kingdom.
In 2018, a report on the three-year review of the 20-mph speed limit initiative was released. The goal was to fill a knowledge gap in the effectiveness of 20-mph speed limit (signed only) schemes (see the Measures section).
Conclusion:
We looked at the topic from a variety of angles in this analysis, but there's still a lot more to learn. The following is a synopsis of our findings:

Danial
Charted Accountant and a Data Analyst