
Sarim
UK's Petrol Price Analysis
• Why is the UK's inflation at a 30-year high due to shifting Petrol prices?
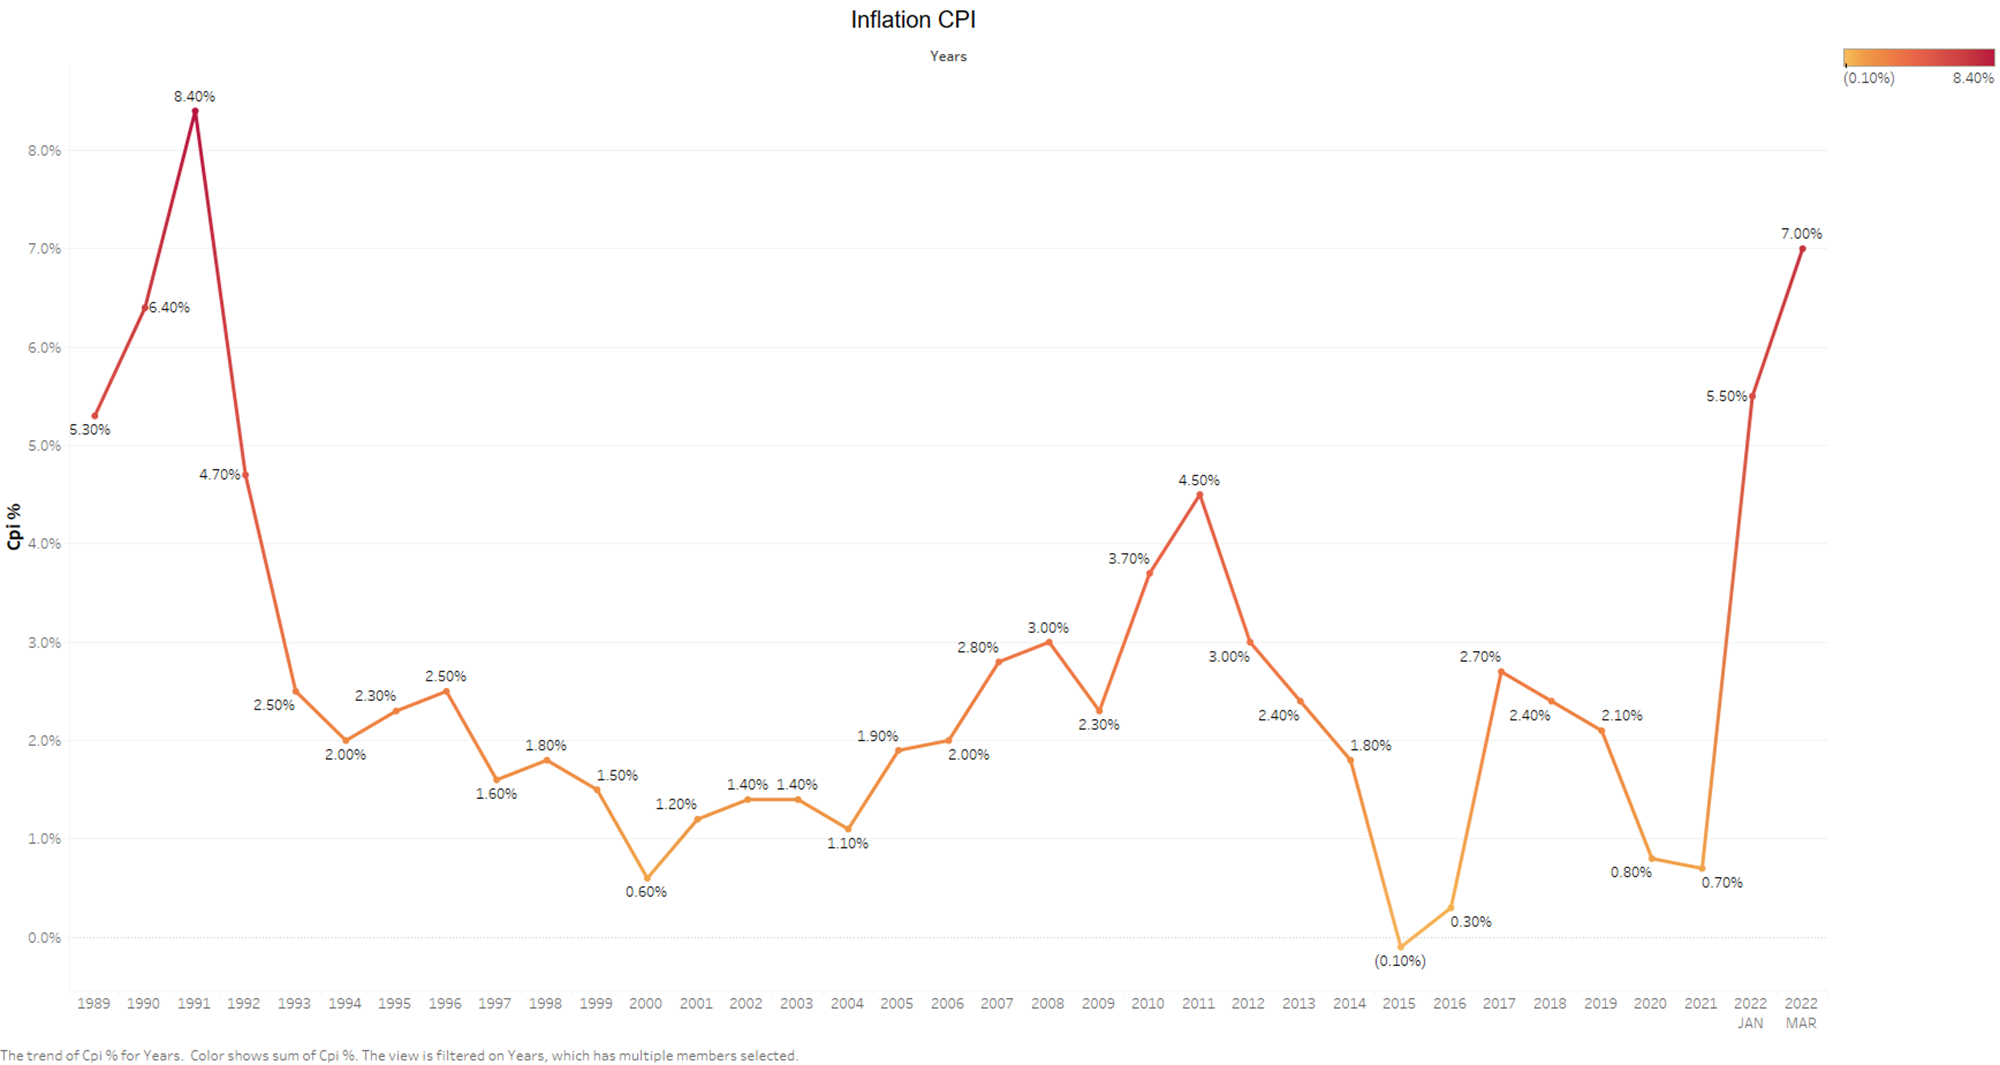
The agony that UK consumers are experiencing is revealed by the latest government inflation numbers, which show that prices increased by 7% in March. This is the highest rate of inflation since 1992, and prices are rising at their fastest rate in 30 years, thanks to a steep spike in the cost of Petrol and diesel.
Prices are rising faster than salaries, and the government is under pressure to do more to assist those who are struggling. The cost of living is expected to rise even more after the energy price cap is raised, causing millions of people to face higher gas and electricity bills.
The Office for National Statistics (ONS) reported that fuel had the greatest influence on inflation, with average petrol prices jumping by 12.6p per litre between February and March, the steepest monthly increase since records began in 1990.
The contribution from transportation has fluctuated over the last two years, ranging from a negative 0.20 percentage point in May 2020 during the first coronavirus (COVID-19) shutdown to a positive 1.47 percentage point in March 2022. This is the highest contribution since the beginning of the National Statistics series in January 2006. Changes in the price of motor fuels have mostly caused the movement in the transportation sector.
According to estimates from the Office for National Statistics, average petrol prices in March 2022 were 160.2 pence per litre, up from 123.7 pence per litre a year earlier. According to the report, the average price of fuel was 170.5 pence per litre in March 2022, making both petrol and diesel prices the highest on record. "The 12-month rate for vehicle fuels and lubricants was 30.7 percent, the highest since before the historic modelled series began in January 1989," according to the ONS.
Average petrol prices are continuing to rise, in keeping with the UK's overall rising cost of living. In recent days, prices at the gas pump have shattered records, with the cost of filling up a car becoming more expensive than it has ever been.
Prices on forecourts across the UK have been rising daily as the ongoing conflict in Ukraine drives oil and petrol prices soaring across Europe. Experts are now predicting that Petrol prices could hit new highs of £2.40 per litre for Petrol and £3 per litre for diesel.
Here's why petrol prices in the UK are so high right now, how much they've risen in the last month, and what's behind the price hike.
• What is the current average price of petrol in the United Kingdom?
According to Experian Catalyst data collected from petrol forecourts across the UK, petrol prices have risen to an average of £1.65 per litre, with a litre of diesel hitting £1.76 today (Wednesday March 16).
• Petrol costs £1.65 per litre. • Diesel costs £1.76 per litre. • What is the source of such high Petrol prices?
Petrol prices are growing in tandem with rising fuel and oil costs around the world, with the impact of Russia's initial invasion and ongoing bombardment of Ukraine pushing up oil prices in March 2022.
• Since the invasion of Ukraine by Russia
When Russia invaded Ukraine on February 24, oil prices soared, and they continued to rise through early March. As a result, road fuel costs skyrocketed to new highs in early March. The weekly fuel prices are shown in the table below.
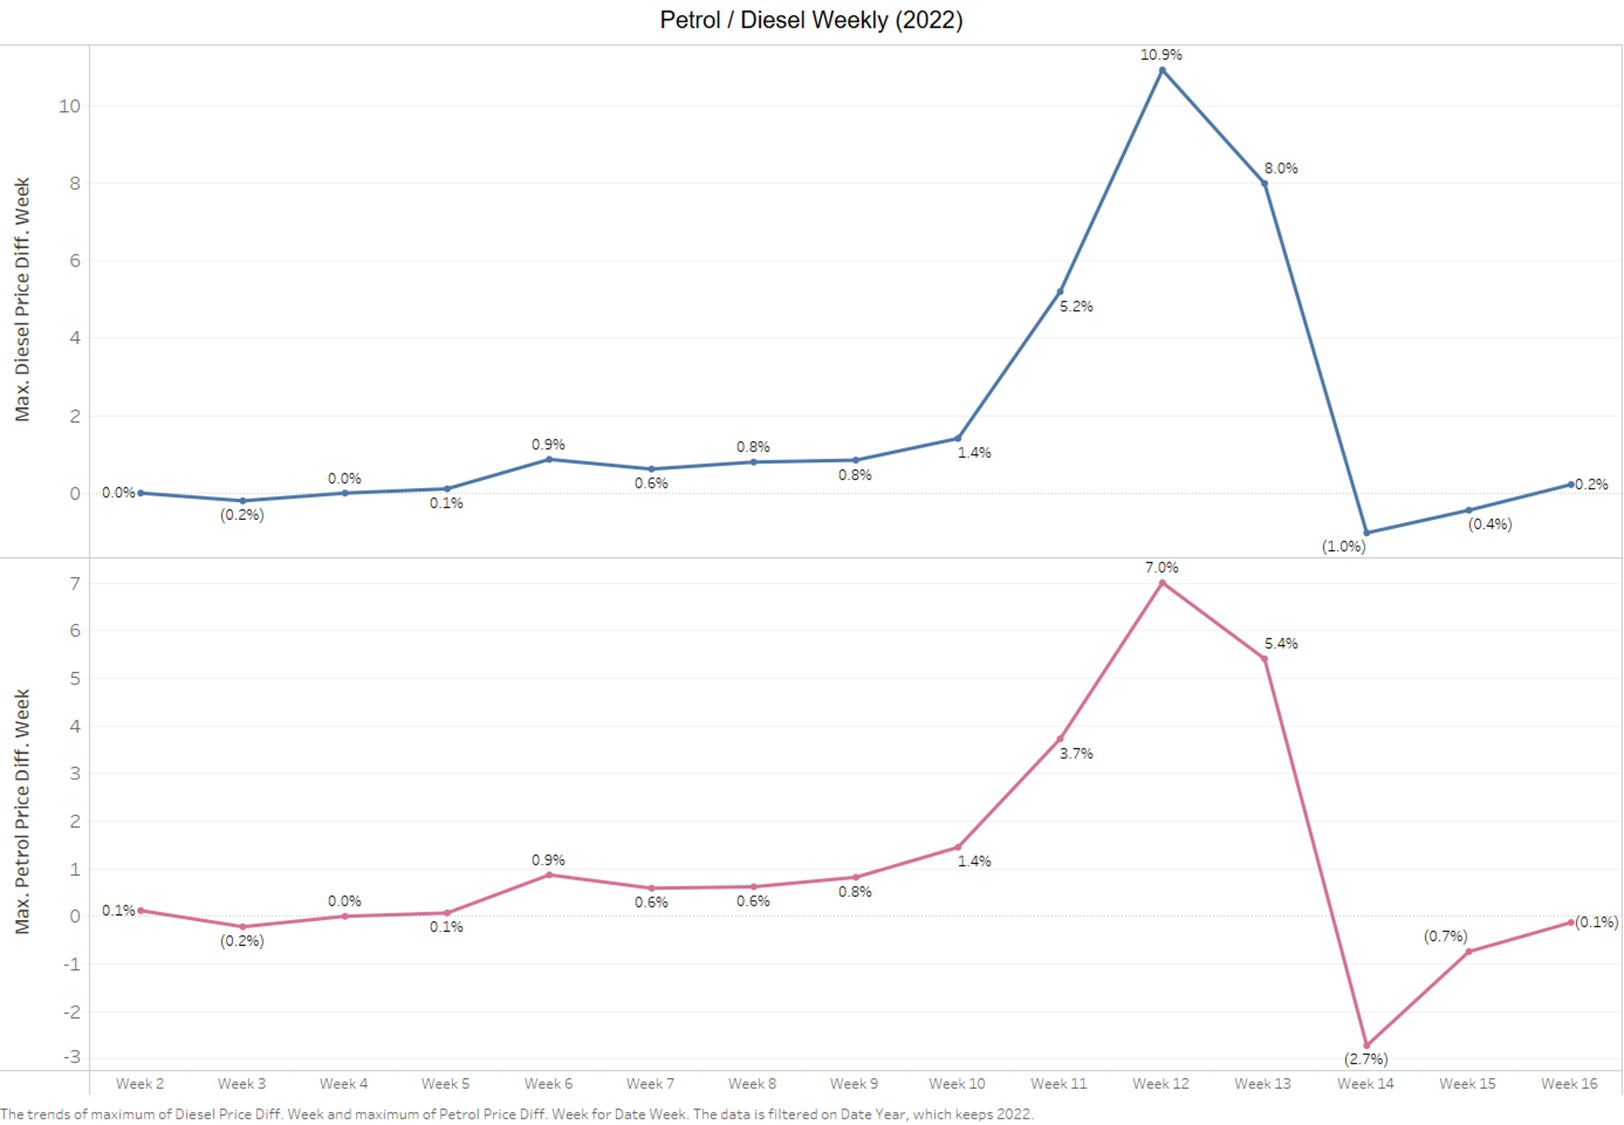
As additional sanctions targeted Russian oil exports, crude oil climbed to more than $105 per barrel in the early days of President Vladimir Putin's invasion of Ukraine, with benchmark Brent crude jumping to about $139 per barrel on Monday March 7.
With much of Europe reliant on Russia's vast oil and gas reserves for its own supply, Western leaders' threat to cut off Russia's oil supplies and seek alternative sources pushed oil prices soaring due to increasing demand. Because crude oil is required to make petrol and diesel, the price of oil has a direct impact on the price of these fuels, as well as wholesale fuel costs in general.
After a price spike in early March, oil prices per barrel have stabilised, but the cost of Petrol at the pump continues to climb and varies greatly across different localities and forecourts in the UK.
• Breakdown of Fuel Price:

• Pre-tax price trends:
For much of the 1990s, the trend in pretax pricing of both fuels was either flat or decreased. Rises in duty, referred to as the "road fuel duty escalator," were responsible for the increases illustrated in the graph below. It's also obvious that changes in pre-tax costs, rather than Petrol duty, drove much of the trend in pump prices.
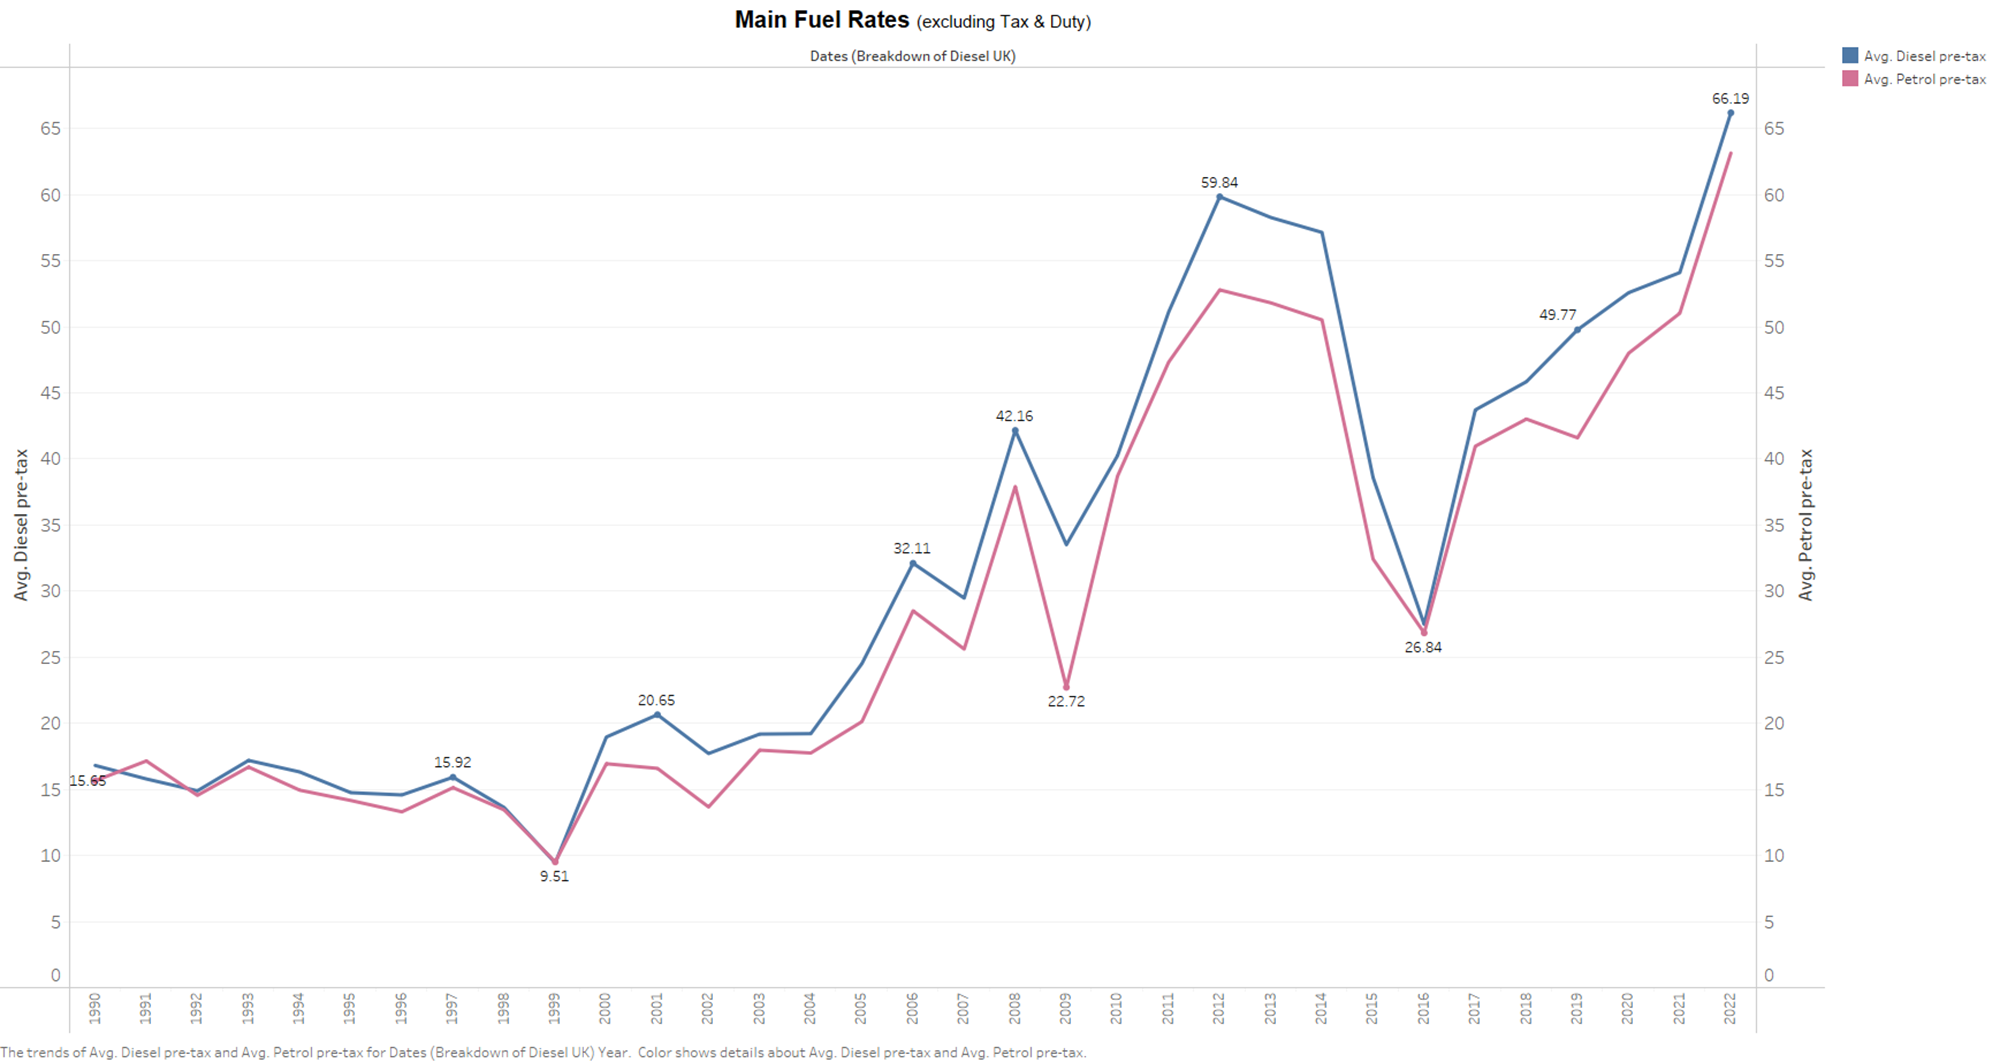
From December 2007 to July 2008, there were new pre-tax highs for both fuels in every month, followed by dramatic drops in late 2008. The pre-tax price of petrol in April 2012 was 60.5 pence per litre, up 18% from July 2008. When it hit 63.0 pence per litre in March 2012, the pre-tax price of diesel had just surpassed its July 2008 high. In April 2012, it climbed to 65.4 pence per litre. For much of 2013, pre-tax prices were pretty steady. The significant drop from early 2015 to early 2016 is plainly visible in the graph. Early in 2016, pre-tax prices for both fuels fell below 30 pence per litre. The decline in costs after the lockdown was greater than this previous drop, although even the lowest pre-tax prices during the lockdown were still higher than early 2016 levels.
• Crude oil prices: The chart below shows the index values for oil prices as well as the pre-tax pricing of road fuel. This indicates that the patterns are generally similar. Oil prices are more volatile, and Petrol prices tend to follow oil price movements.
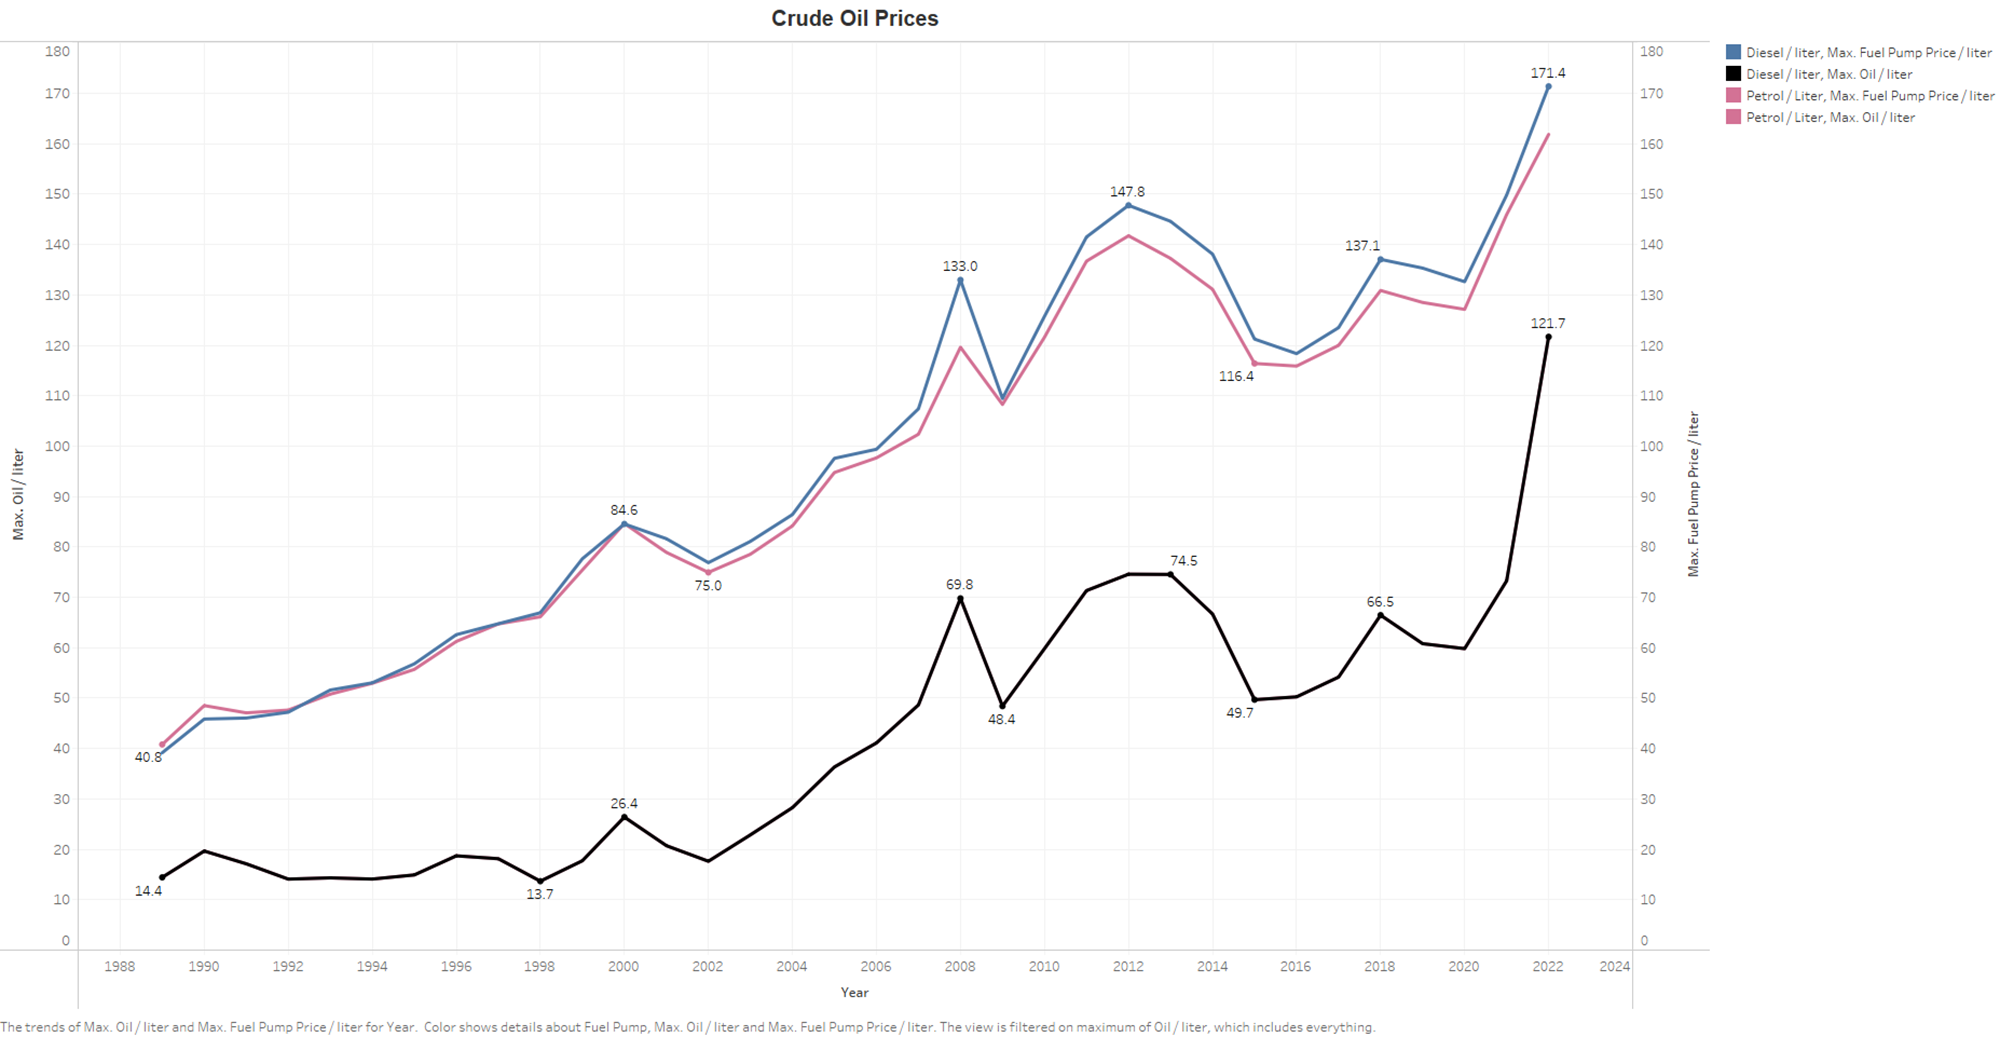
The pre-tax pricing does not only comprise crude oil prices; it also includes refinery costs/profits, transportation, and marketing. The government does not disclose data on the breakdown of these components on a regular basis.
• Why did the drop in oil prices in late 2008 not coincide with a drop in the price of road fuel?
For much of the rest of the year, headline oil prices declined, but these drops were not replicated in Petrol and diesel prices. Oil corporations and/or fuel retailers are accused of failing to pass on these cost benefits. There are a few other explanations for some of the trends' variation. To begin, duty accounts for a sizable portion of the retail price of these fuels. Oil price changes only influence the pre-tax part; thus we should expect a smaller percentage change in retail pricing.
Second, since the drop in oil prices began, the US Dollar has become stronger. As a result, the drop in oil prices when expressed in Sterling is lower than the headline Dollar statistics. The forward month price — the price for oil delivery in the following month – is frequently quoted in the news on a daily basis. As a result, there may be some lag between daily oil price drops and forecourt pricing reduction. With the recent high level of market volatility, timing is particularly critical.
The UK petrol and diesel industry is the subject of a report by the Office of Fair Trading. An OFT Request for Information looked at assertions that forecourt prices rise more quickly after a wholesale price increase than they do after a wholesale price decrease, Prices are believed to increase like a rocket then fall like a feather in what is known as rocket and feather pricing.
• Taxes' Effect on Fuel Prices:
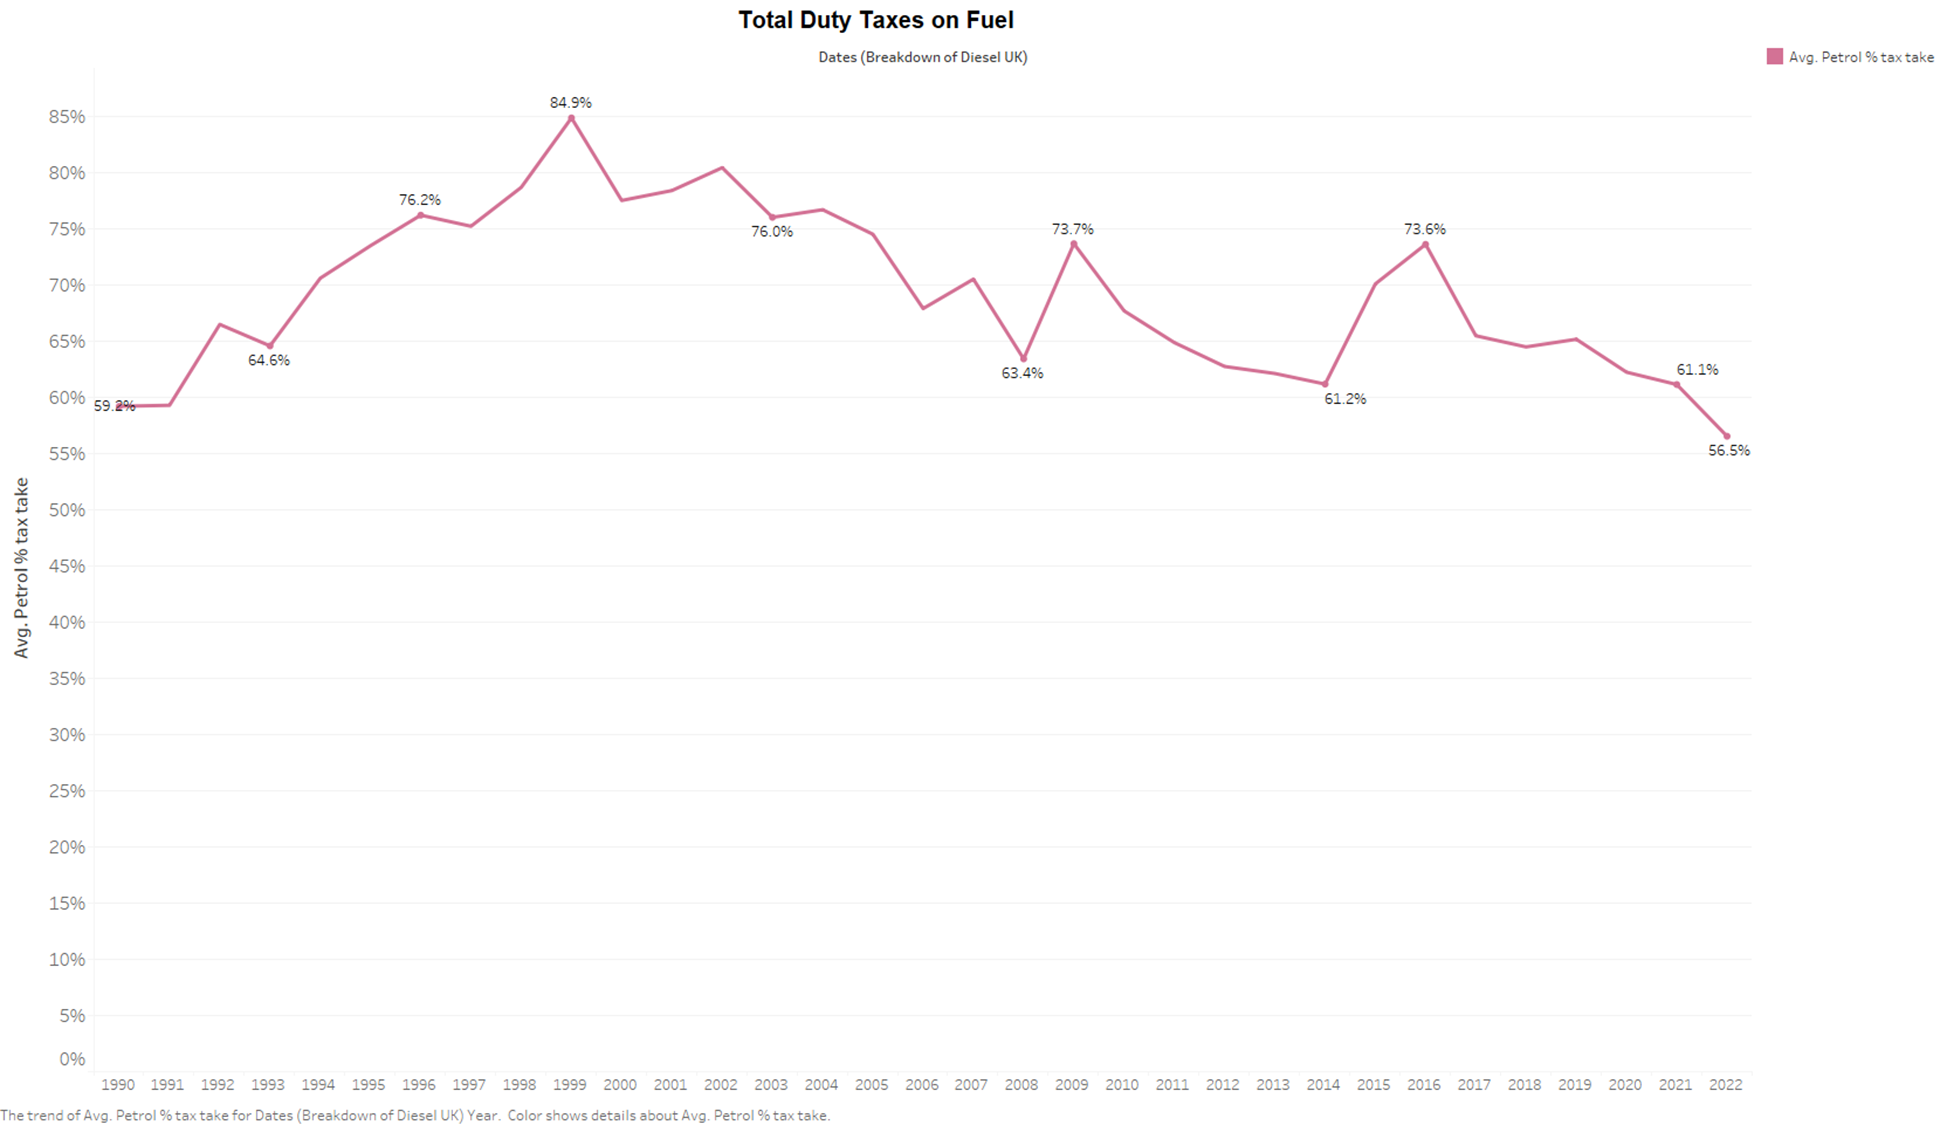
The graph below depicts how the overall tax revenue from road fuel has changed over time. During much of the 1990s, falling fuel costs and the fuel duty escalator saw the tax take grow to an all-time high of 86 percent in early 1999. The tax take fell to 57 percent (petrol) and 53 percent (diesel) in July 2008, owing to relatively slight increases in duty between 2001 and 2008 and increased oil costs. As prices plummeted in late 2008 and early 2009, both rates increased: petrol to 74% and diesel to 66%. Since then, the tax take has fluctuated between little over 50% when prices peaked in spring 2012 and approximately 75% in early 2016, as prices have fallen. The latest tax take in October 2021 was 58% for petrol and 57% for diesel.
The graph below shows changes in duty rates in terms of cash. This clearly demonstrates the increases in the 1990s as a result of the road fuel duty escalator's operation. VAT is applied to the post-duty price, as well as to the duty and pre-tax price. For the time period depicted, duty rates on each fuel were similar or extremely close, so any variation in total VAT per litre may be traced back to the pre-tax price.
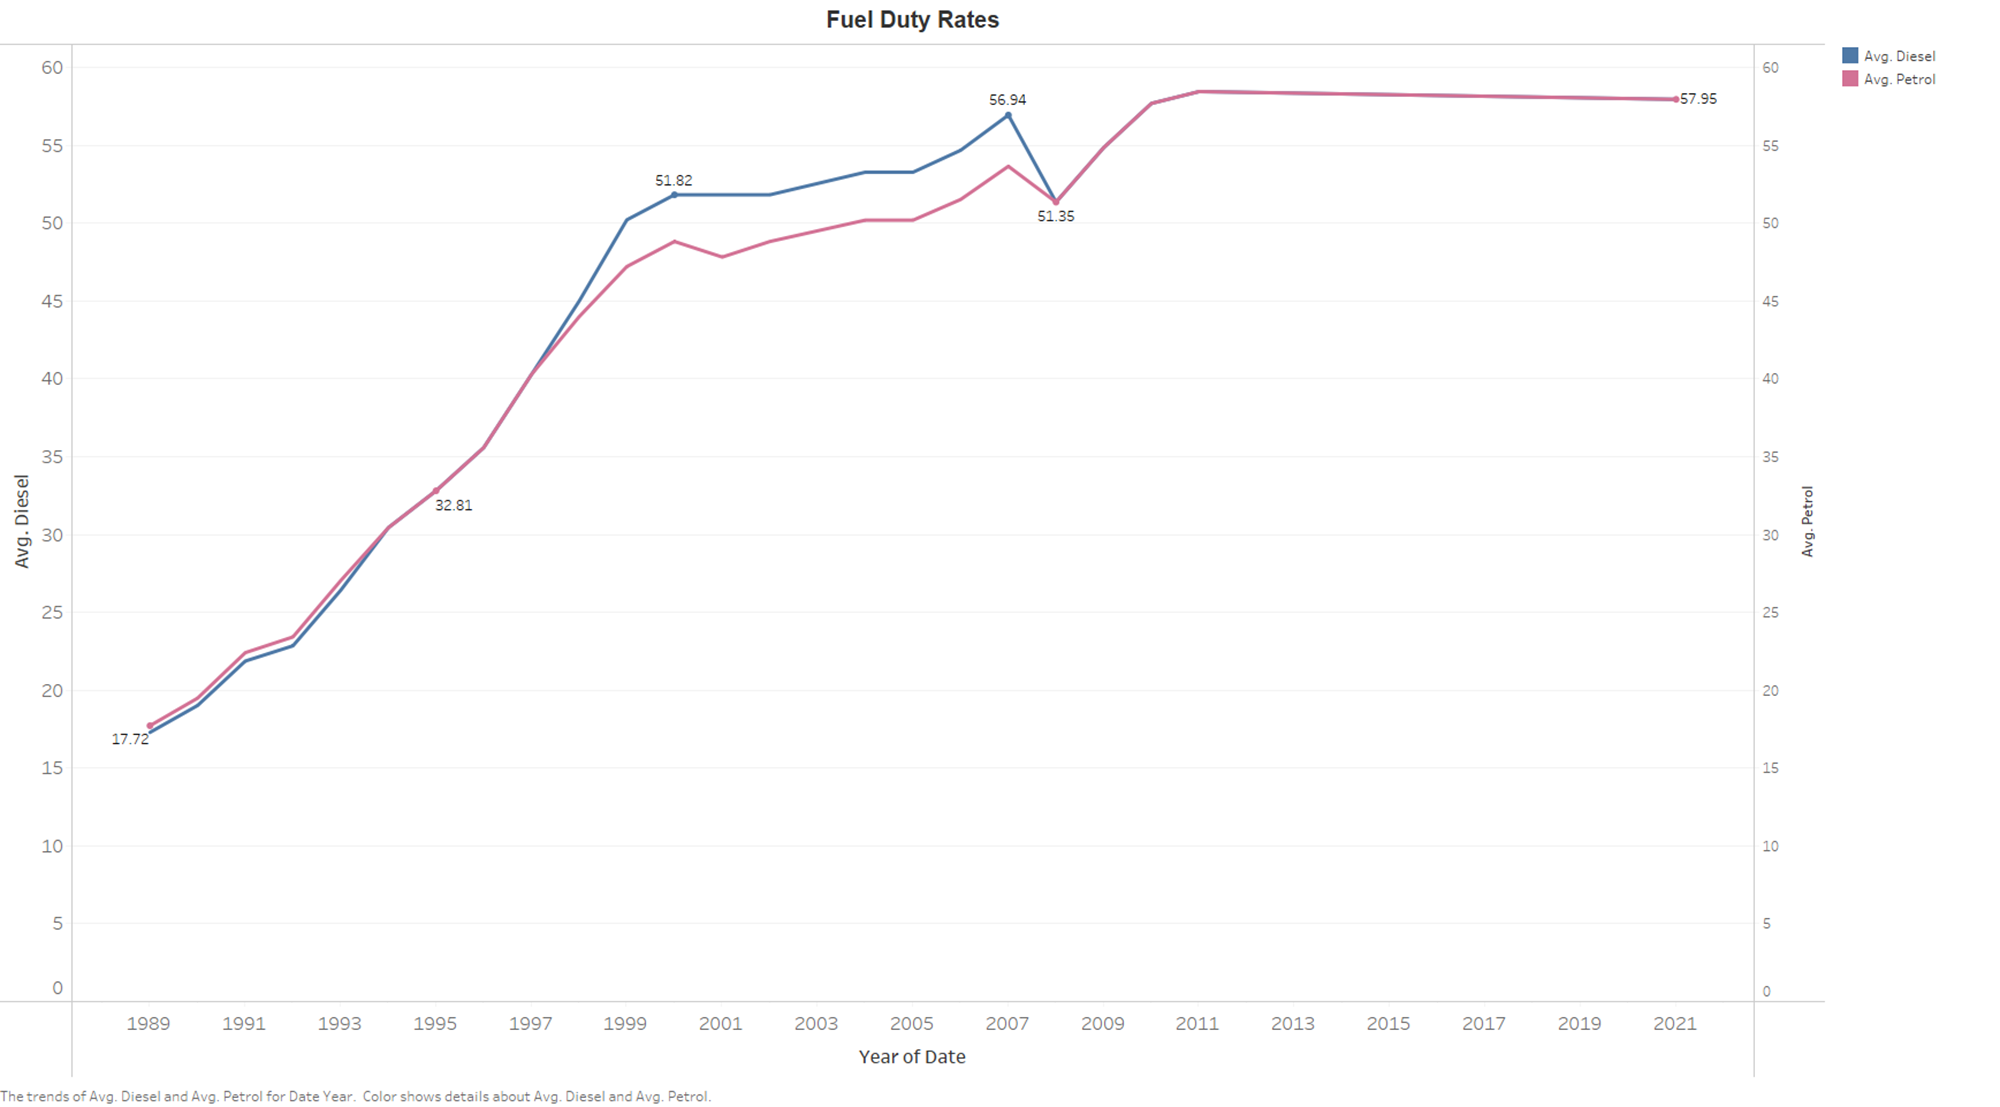
From early 2000 to March 2011, duty rates were reduced or frozen for a total of about six years. The rate of petrol in real terms is plotted in the following graph. From 2000 to late 2008, it demonstrates a gradual reduction in the real rate of duty. Duty had been lower in actual terms since autumn 1996 by the autumn of 2008. The real duty rate rose dramatically in 2009 as a result of subsequent duty rises and lower/negative inflation. Increases in duty between 2010 and January 2011 were virtually matched by greater inflation, ensuring that the real level stayed relatively steady. The duty drop in Budget 2011 brought real rates down to levels seen in early 2009, and the subsequent duty freeze has resulted in the lowest real value since November 1993.
Increases in pre-tax prices add to the VAT on a litre of Petrol. The VAT rate was reduced from 17.5 percent to 15 percent at the end of 2008 (in reaction to the financial crisis), raised to 17.5 percent at the beginning of 2010, then increased to 20 percent at the start of 2011.
Between summer 2000 and summer 2007, the real value of the total tax on a litre of Petrol declined by around one-sixth. The real value of the tax peaked in late 2010 as a result of increases in duty, VAT, and the pretax price (therefore VAT once again). The reduction in duty, followed by a freeze, and typically lower pre-tax costs have all contributed to a reduction in the real worth of tax on a litre of Petrol. It was 32% lower in February 2021 than it had been at its peak.

Sarim
Software Engineer and a Data analyst, I help people to reach new Heights